The Angel Edge – John Jonelis
From the Journal of the Heartland Angels
Yes you can – you CAN measure the future!
Drawdown
According to the Kauffman Foundation, Angel Investors—on average—enjoy a capital gain on three out of ten deals. Out of those—on average—one is a huge blockbuster winner, three—on average—do marginally better than break-even, and the other six—on average—are complete losers. The winner is so huge that, according to Kauffman, Angels do very well indeed—that is, on average.
You may ask, “Hey Jonelis, why all the harping on the word average?” Because average is a fantasy. It doesn’t exist for you. It doesn’t exist for me. It’s a composite of the whole crowd.
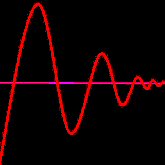
We’re all familiar with the equity line, which gives an overview of our investment returns over time. We all want ours to look positive and smooth—something like the cartoon at the opening of this article. I do. This is hope.
In reality, we all experience drawdowns to our accounts. We hope the trajectory is positive, governed by careful decision-making, and wise management and that could be true in some cases. But the smoothing of the line comes from diversification. You cannot achieve it with a handful of private equity deals. And one healthy drawdown can put you out of business. Permanently. Your account can blow up.
Risk lies in nasty places where most investors never stick their heads. A lone-wolf angel investor that places large chunks of grandma’s pension fund in just a few companies is likely to meet with disaster. It’s like betting on a few rolls of the dice. To make it worse, you plunk down your money, then wait and hope a long, long time. A lot of bad stuff can happen.
.
Measuring What’s Possible
But we can make use of a simple technique to forecast the future. It’s relatively obscure but don’t let that throw you. This is a really simple way to estimate the range of possible outcomes. It’s called a Monte Carlo simulation. You feed-in a series of winners and losers and let the computer string them together with replacement many, many times. Say 100,000 times. It might look like the chart below:
So what is that mess? I mean, this is a whole lot more information than the cartoon at the beginning of this story. But in reality, it’s nothing more or less than 100,000 hypothetical future equity lines. Your portfolio may lie along any one of them. Some of these outcomes are wildly positive, but some of them go negative a long time and you go broke. Notice that more of the lines cluster in a central core. It’s more likely that you’ll wind up somewhere in that group. But no guarantees—and even some of those are lousy outcomes.
What you’re looking at is a graphical representation of Risk. I think about this problem a lot. It’s entirely possible that I’ll see a frighteningly long string of losses. Maybe I’ll never see a single gain. Maybe my children will get rich. Or I could see five big winners in a row this year! The probabilities are all over the map. So that brings us to the question I’ve asked before: Are Angels fools? Maybe, but I hope not. Let’s talk about getting the situation under control.
.
Controlling Risk
The game is to get that scatter plot narrowed-down and headed in the right direction. Nobody but a lunatic wants possible outcomes as wild as that last chart.
The big banks and hedge funds are doing this for their stock, futures, and currency portfolios—(and yes, my charts are taken from that world). A robust strategy in those markets can be right 60 to 70 percent of the time. Of course, to be right that often slices returns thinner and thinner till the strategy finally stops paying off. But the advantage to being right so much of the time is very small drawdowns. Small drawdowns mean less chance of going broke. Look at this chart:

That’s more like it. Who wouldn’t be all-in with that set of possible outcomes? I admit it’s wildly exaggerated, but hey—it makes a point. You don’t need a PhD in Statistics to see that the strategy in this chart is a whole lot better than the previous chart. Just compare them! Which one do you like? That’s how to use this technique!
.
Making the Magic Work
For a simple but more detailed explanation, see my white paper, ALTERNATE HISTORIES [click here] “But,” you rightly object, “That paper deals with short-term trading. How do you apply that to Angel Investing, which is anything but short term?” Well, I think we can answer that one. Let me suggest an experiment:
Using Kauffman’s averages, make up a few sets of imaginary investment outcomes—sets of ten. Each set will have one huge winner, three mediocre to break-even results, and six complete losers. For units, use dollar gain or loss in a range that fits your investment horizons. Shove those numbers into a Monte Carlo software package.
Here’s the drill: Run this several times, each time with a larger quantity of sets. You want to find out how much deal flow results in a range of outcomes you can live with. That gives you an estimate of your risk. Like I said, it’s simple.
By the way, don’t invest in an expensive, complicated Monte Carlo package. Get a simple one, like the free Equity Monaco package offered by TickQuest. [Find it here] ■
.
Read it in NEWS FROM HEARTLAND [click here]
.
![]() NEWS FROM HEARTLAND – The Journal of the Heartland Angels, is published quarterly as an information service to its members. Articles may be reproduced in full with attribution for educational purposes. Copyright © 2014 Heartland Angels – John Jonelis, Editor – John@HeartlandAngels.com
NEWS FROM HEARTLAND – The Journal of the Heartland Angels, is published quarterly as an information service to its members. Articles may be reproduced in full with attribution for educational purposes. Copyright © 2014 Heartland Angels – John Jonelis, Editor – John@HeartlandAngels.com
CAVEAT EMPTOR – These articles are for educational purposes and not investment advice. Investment involves substantial risk. Please perform your own due diligence. Contact Ron Kirschner – Ron@HeartlandAngels.com
FOR MORE INFORMATION – www.HeartlandAngels.com
.
.

Chicago Venture Magazine is a publication of Nathaniel Press www.ChicagoVentureMagazine.com Comments and re-posts in full or in part are welcomed and encouraged if accompanied by attribution and a web link. This is not investment advice. We do not guarantee accuracy. It’s not our fault if you lose money.
.Copyright © 2014 John Jonelis – All Rights Reserved
.
.